Overview
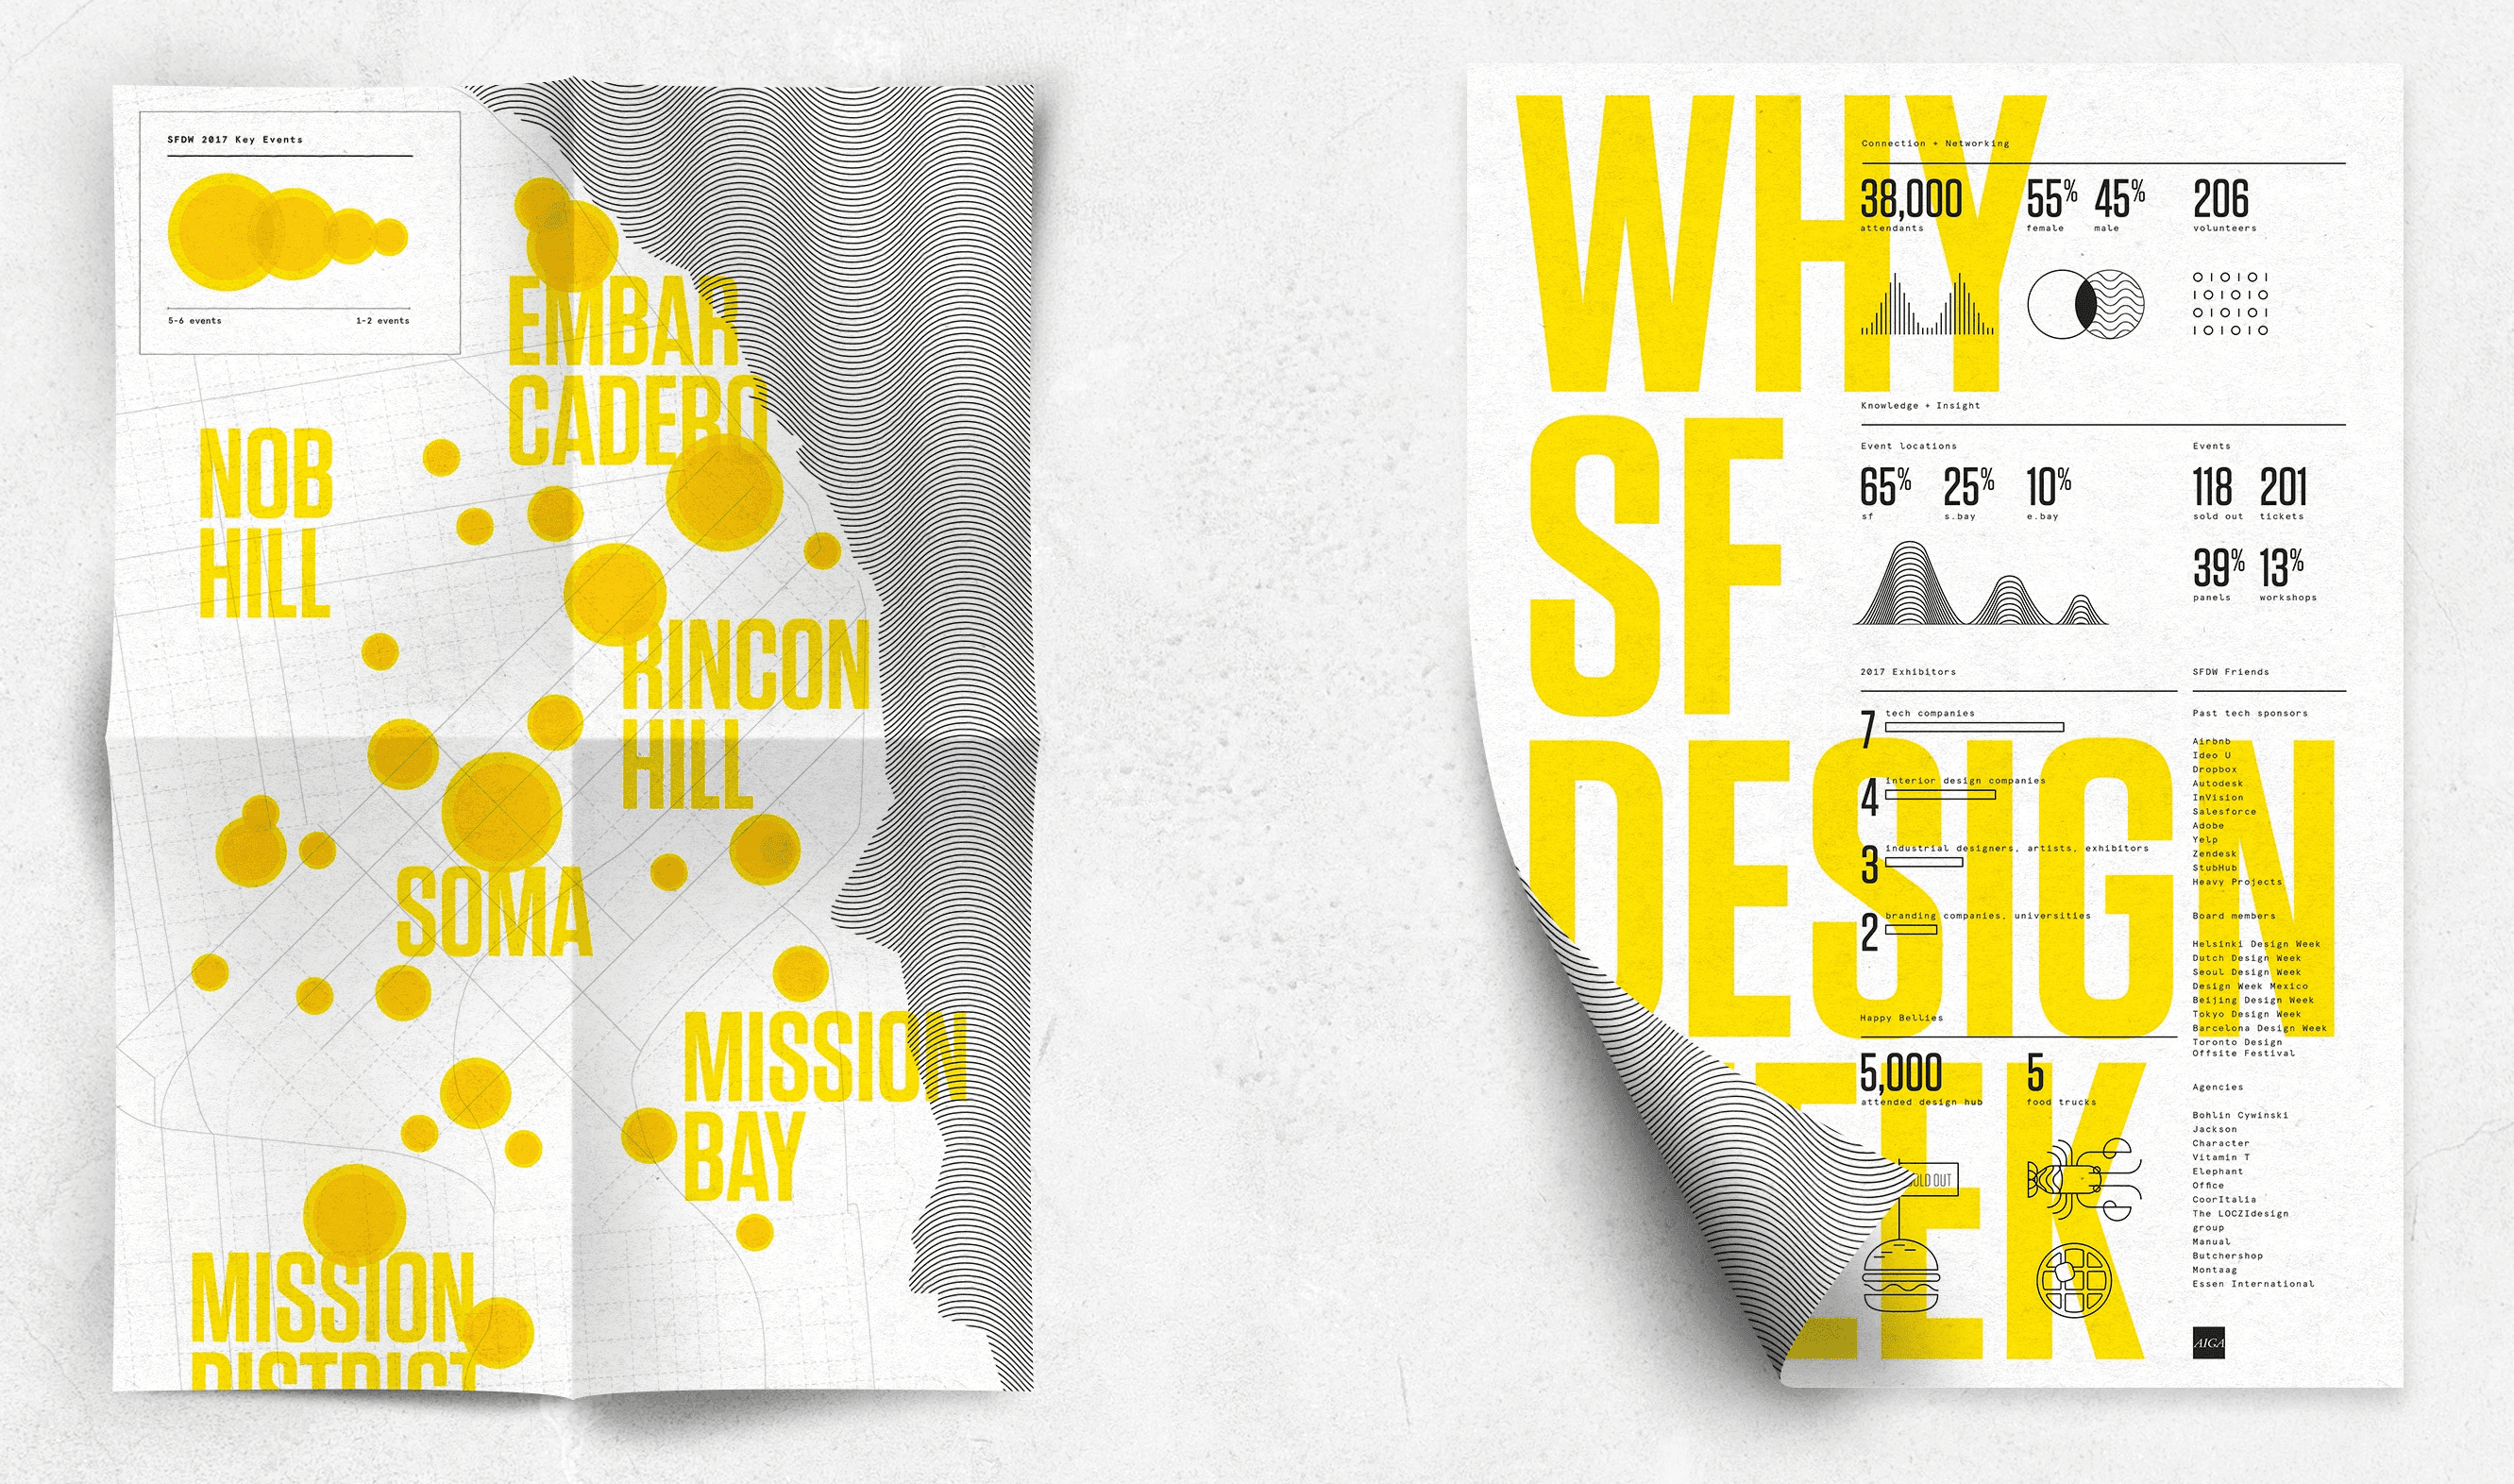
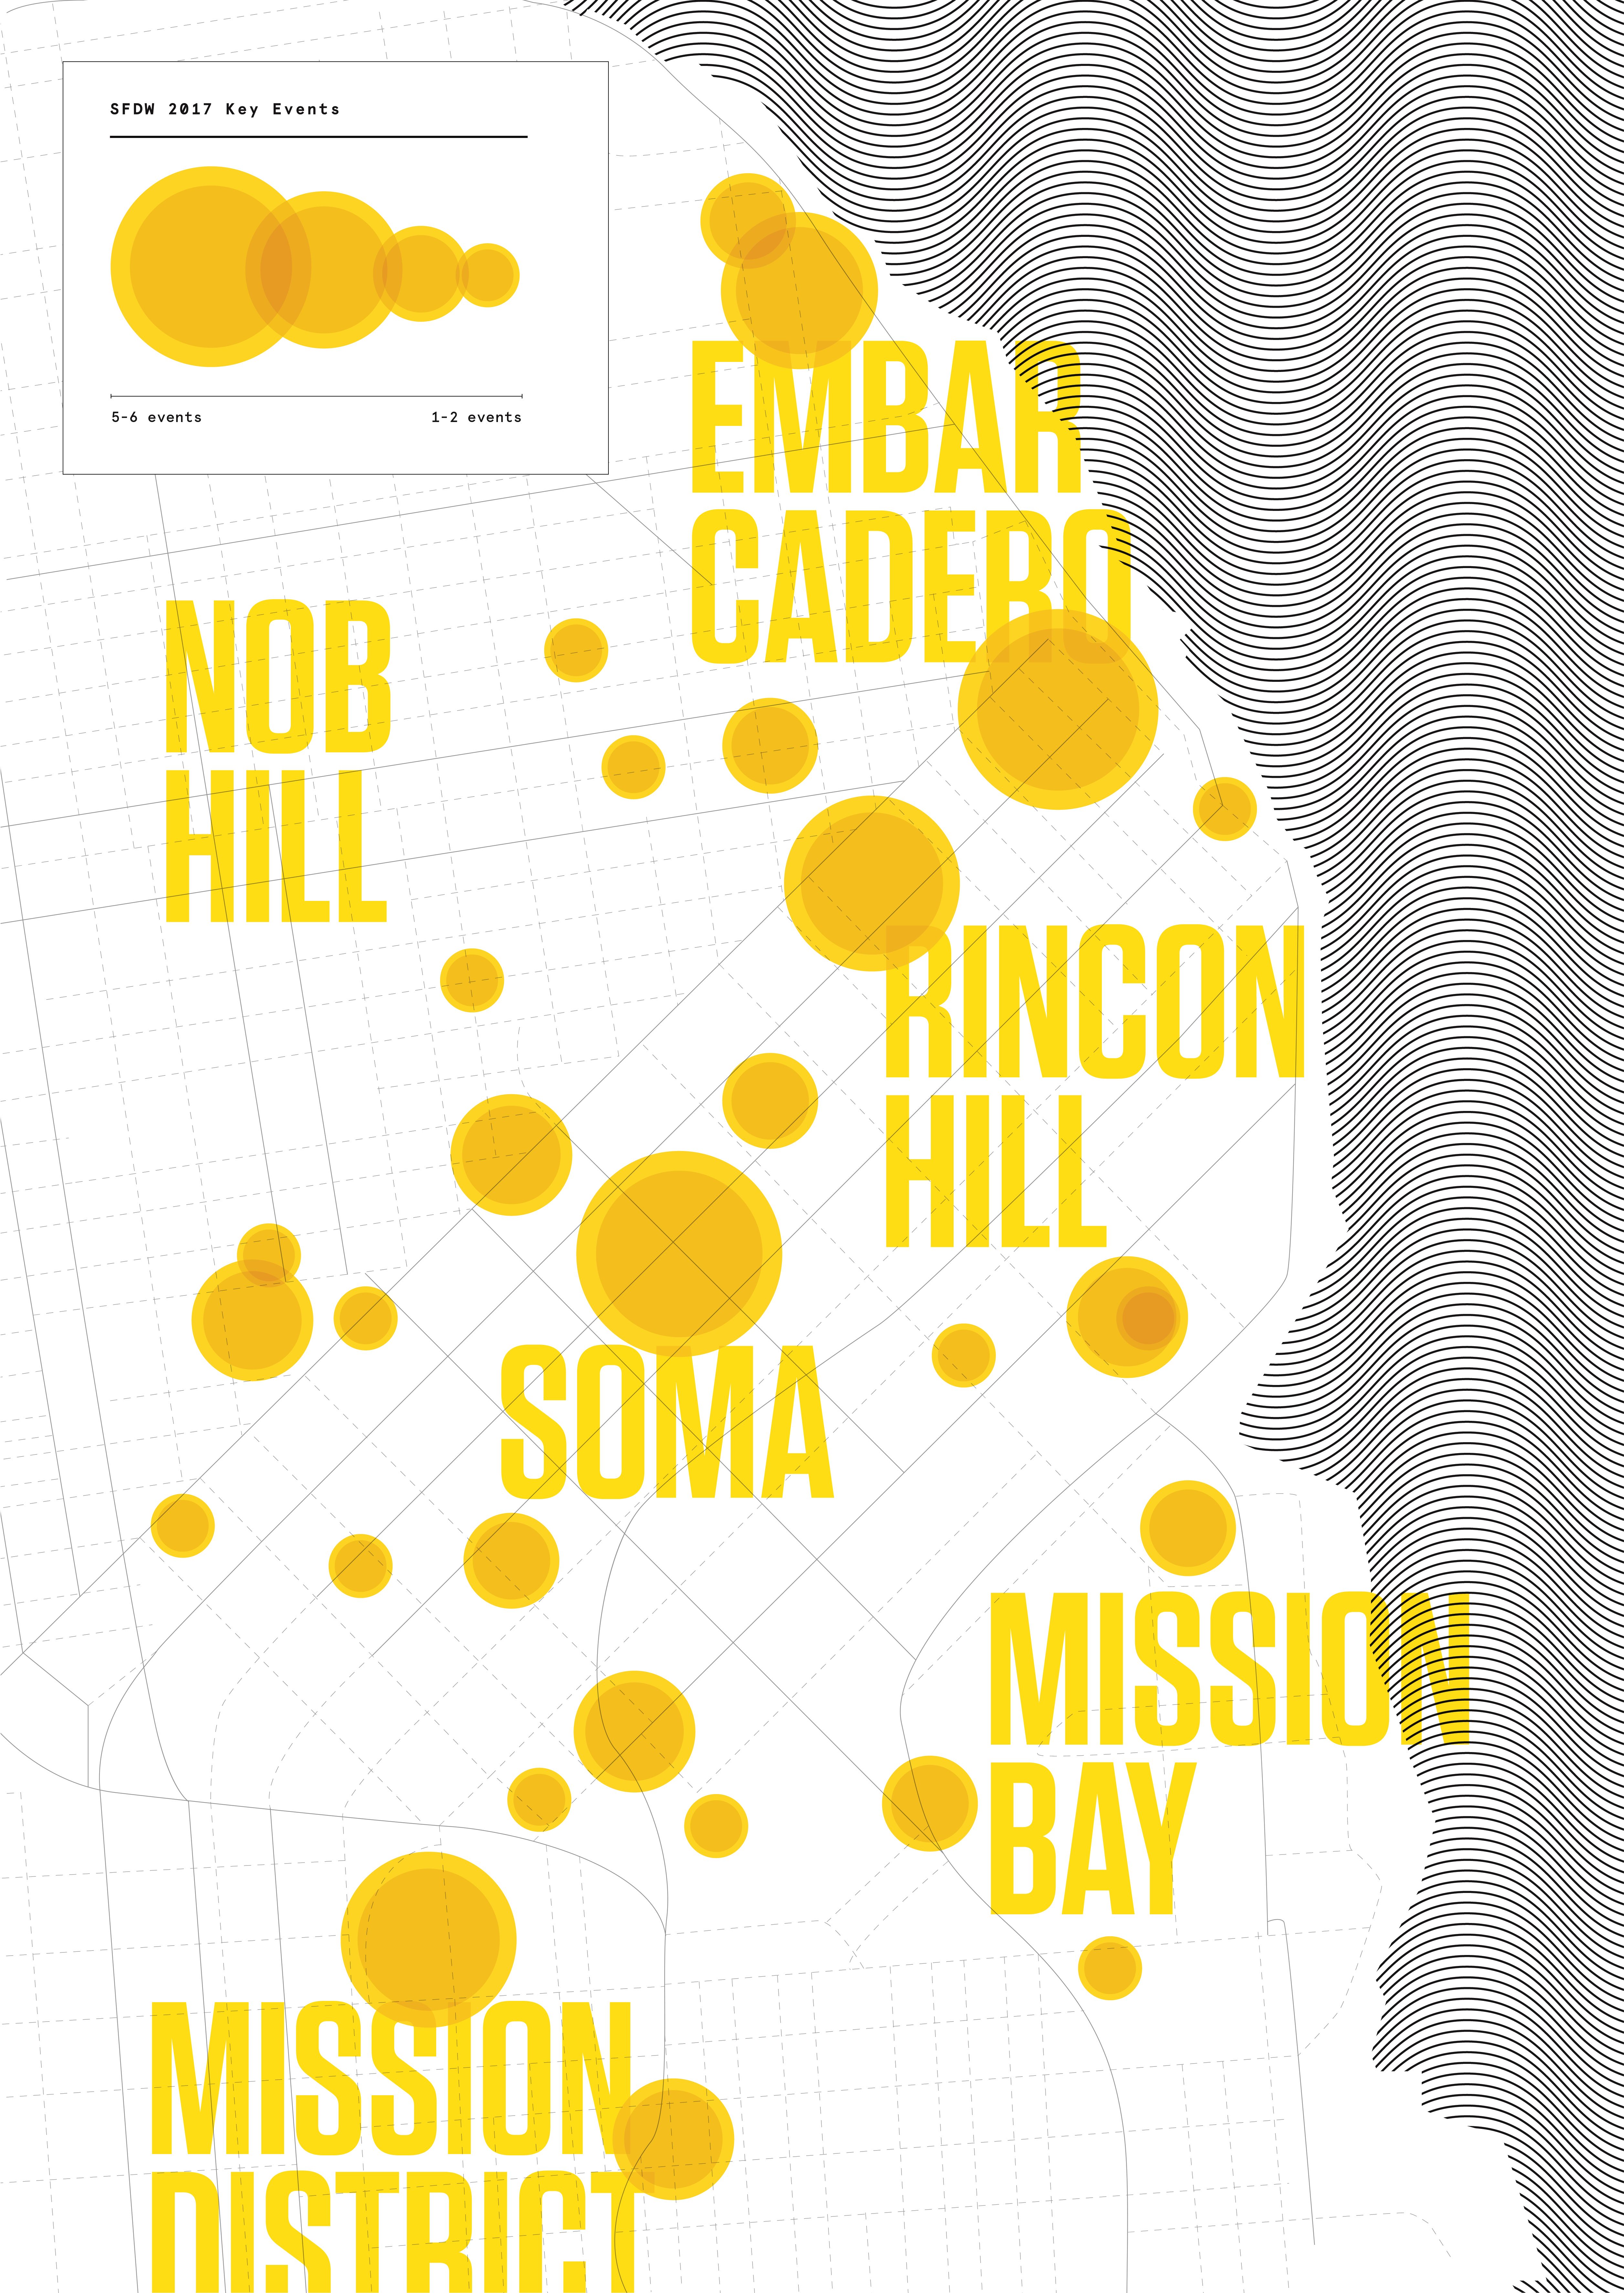
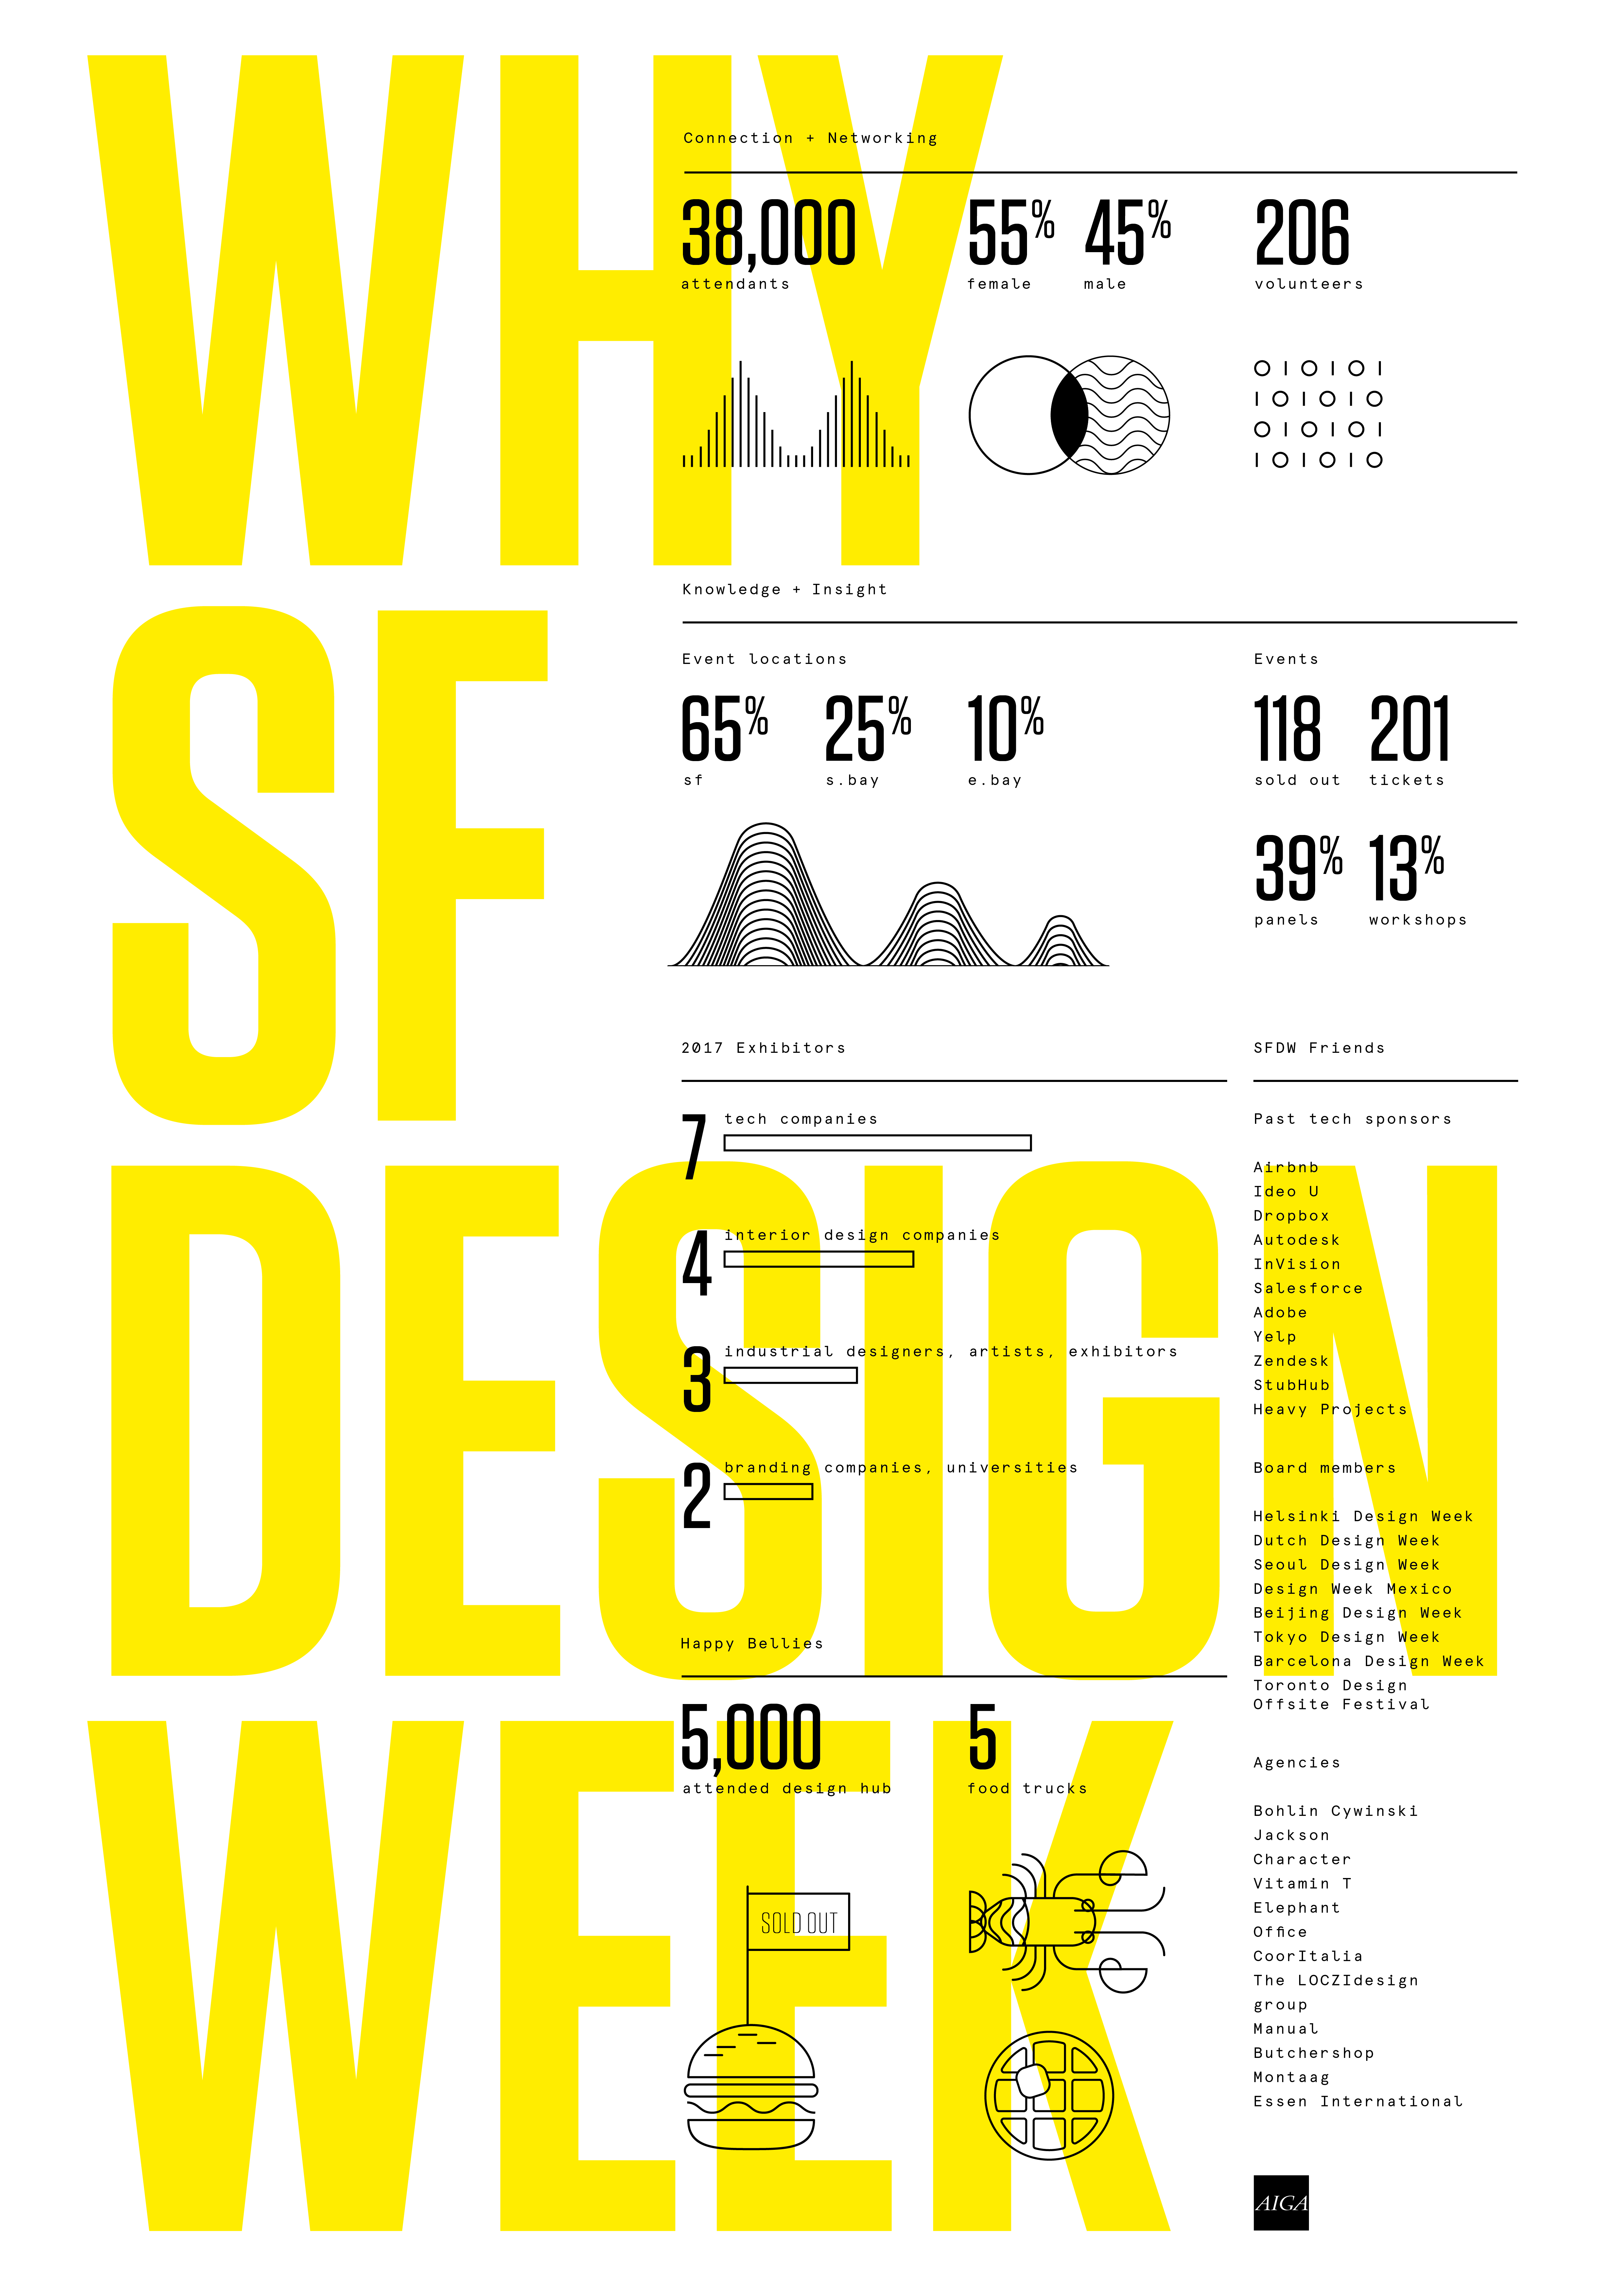
AIGA approached us to collaborate on an infographic poster highlighting data from previous SF Design Week events. The objective was to get more design agencies and vendors involved. I led the creative and gathered data to visually communicate the narrative through data viz.
Challenge
Results
Our team won the AIGA committee's approval with our approach: data visualizations and custom icons unified by bold typography. We took inspiration from geographic isometric maps, adapting that style to our icon system and balancing it against strong type. We couldn't have been happier with the outcome.